The core elements: Risk, Capacity, Negligence
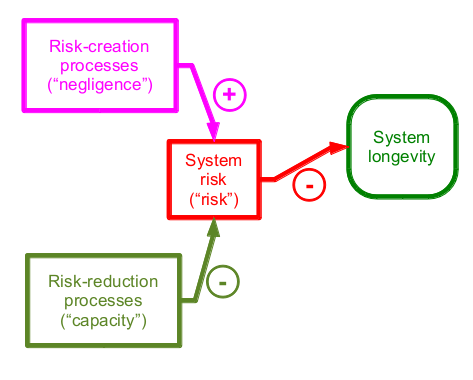
The Risk-Capacity Model is a simple simulation of the survival of a system. The system might represent an organisation, market, nation, or Life on Earth. The four main variables the Risk-Capacity model are:

- Negligence (input variable) — the degree that risk increases a time period
- Capacity (input variable) — the degree of risk reduction in a time period
- Risk (middle variable) — the chance of the system terminating in a time period
- Longevity (calculated result of the model) — the chance that the system has survived to a particular time period
The core message of the model is: if the growth of risks exceeds our ability to reduce risks, then the expected lifespan of the system is short.
Example systems
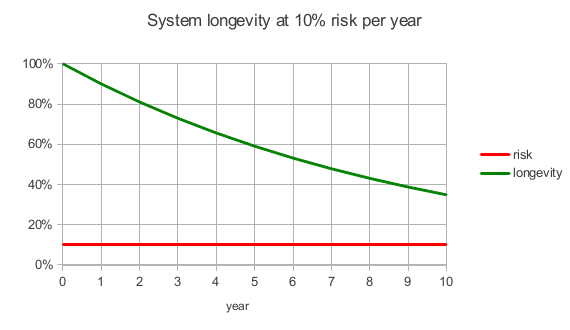
Let's start by examining only the effect of risk on system longevity. In a system that has a risk of 0.1 (ten percent) per year, there is a 90% chance of surviving to the second year, a 81% chance (90% × 90%) to survive until the third year, and so on:

By the tenth year, there is less than a 40% chance that the system will have survived.
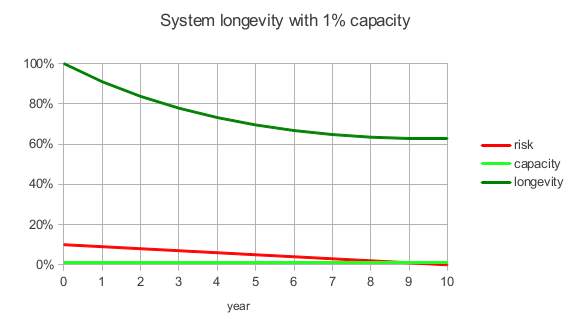
In this next model, the risk level starts at 10% as it did in the previous model, but now there is 1% capacity:

By the tenth year, all risk has been eliminated and the chance that the system survives has stabilised at about 60%.
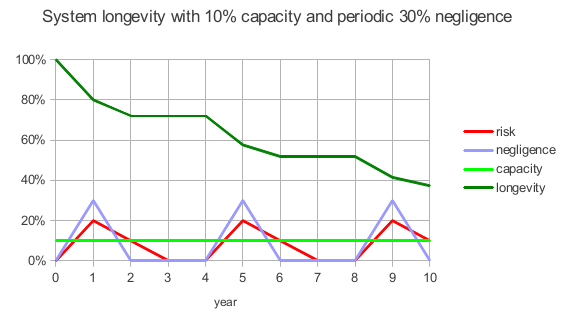
In this next model, risk starts at 0, capacity is 10%, and there are periodic spikes of 30% negligence:

This system has a 40% chance of surviving ten years.
Details on using the Risk-Capacity Model for system simulations
All three variables — risk, capacity, and negligence — range from 0.0 to 1.0 each period. Capacity and negligence could either be constants or the result of a process (e.g. to simulate negligence that introduces in batches, such as the third example system above, or capacity that waxes and wanes over time).
Each period, risk is reduced by capacity and increased by negligence. In examples 2 and 3 above, this was a simple addition: 10% risk - 1% capacity = 9% as in year 2 of the second example. You could also use multiplication, in which case year 2 of the second example would have only been reduced to 9.9% risk.
The value of system longevity is equal to 100% minus the cumulative risk so far. Thus, each period, the new longevity is calculated by subtracting the risk level from the previous longevity:
longevity2 = longevity1 × (100% - risk)
Simulating choices
When using the Risk-Capacity Model to present choices, the variable of risk cannot be directly altered. Instead, actors in the model can only be presented with choices regarding either of the two input processes, negligence or capacity. For example, you might simulate:
- what happens if capacity is increased?
- what happens if negligence is decreased, or made less volatile?
Other examples of model variations
You could also elaborate the capacity component of the model to have more sub-aspects, for example to simulate the need for risk assessment. Such a modification have two additional variables:
- Transparency, from 0.0 to 1.0, indicating the degree to which risks are understood, and can therefore be dealt with or reduced
- Work, from 0.0 to 1.0, simulating the amount of resources applied to risk reduction
- Capacity = Work × Transparency
- Transparency = Transparency - RiskGrowth
Adding this to the Risk-Capacity model now lets you simulate two ways in which we might improve our capacity to reduce risk: either through risk assessment or capacity-building.
Notes on external risk and nesting models
Typically, the risk to one context is lower than the risk to its enclosing context. However, the risk to the larger system is a hard limit to the risk of its subsystems.
For example, in a battleship at port, the risk to an individual sailor's life is due more to internal factors (i.e. heart disease), and self-care (risk reduction) activities consist of exercise and diet. When the ship is at war, the risk to the external system (the ship itself) exceeds risk from internal factors, and the sailor's survival depends more upon helping his entire unit survive.
To model this, one would decrease the percent chance of longevity by either the risk of the system or by the risk of its enclosing system, whichever is greater in that time period.
